
2/23/2024 Estimated DRS count: 76,100,046 ((using today's DRSbot total + fix inadvertent DRSbot offline or resets) x 4.129) The 4.129 multiplier comes from 11/30/2023 Form 10-Q divided by DRSbot 11/30/2023 total: 75,400,000 / 18,262,331 = 4.129 Bloomberg data (to 12/9/2023), 12/31/2023 Blackrock addition, 12/29/2023 Vanguard addition, DRS estimated count, stuck in IRA estimates, and other: |Holding|Number of shares|As of| |:-|:-|:-| |Former Insiders (Other)|14,339,510|12/9/2023| |ETFs|29,950,420|12/9/2023| |MFs, Index Funds, Pension Funds, etc|36,902,186|2/13/2024| |Other Institutional Ownership|30,102,685|12/9/2023| |Insiders|38,655,910|12/9/2023| |DRS'd - 200k Computershare accounts|76,100,046|2/23/2024| |Non-DRS - 200k acct if 30% stuck in IRA|22,830,014|2/23/2024| |Non-DRS - 200k acct if 50% stuck in IRA|15,220,009|2/23/2024| |Other|41,413,535|2/23/2024| * Total Outstanding on 11/30/2023: 305,514,315 * Thank you to lawsondt for the Bloomberg data to 12/9/2023 * Vanguard increased shares by 785,823 on 12/29/2023 (2/13/2024 file date). From 24,664,433 to 25,450,256. * Blackrock increased shares by 567,123 on 12/31/2023 (1/26/2024 file date). From 21,977,404 to 22,544,527. * "Non-DRS - 200k acct if 30% stuck in IRA" is a conservative percentage. The Google share count surveys have suggested the 200k Computershare accounts have 40-50% additional shares stuck in IRAs. * "Fix inadvertent DRSbot offline or resets" is primarily whale #1's 1,390,972 DRS shares (as of 1/4/2024). Long story of switching subs and losing her DRS share count. So added the "fix inadvertent" column to capture her DRS shares. * Starting 1/4/2024, whale #1 started gift transferring DRS shares to others. 1,390,995 (on 12/25/2023) to now 1,390,972 (on 1/4/2024). Unfortunately, Computershare only allows one gift per month, and only up to $2000. Discussion points: * It seems odd on some of the DRS count fluctuations since the beginning. * There have been 2 "somewhat hidden" 2022 rugpulls (May 2022 and Aug/Sep/Oct 2022), the June 2023 Mainstar rugpull, and now the Sep/Oct/Nov 2023 rugpull. * It seems odd on recent DRS count stagnating (excluding the Mainstar rugpull of 1.27 million shares). From a very simplistic view assuming 200,000 Computershare accounts: |Buy X number of shares a month|Multiply by 3 months per quarter|Total DRS per quarter if 100,000 active accounts|Total DRS per quarter if 200,000 active accounts| |:-|:-|:-|:-| |1|3|300,000|600,000| |2|6|600,000|1,200,000| |3|9|900,000|1,800,000| |4|12|1,200,000|2,400,000| |5|15|1,500,000|3,000,000| * The April 2023 list of stockholders DRS numbers seem correct and line up with SEC filings. * Possible some investors have had to un-DRS. * Possible economic slowdown and inflation have reduced investor purchasing power. * Possible whale investors who helped inflate DRS numbers alot, have dramatically slowed down their purchasing. * Tinfoil - certain parties inflate DRS shares 9 to 18 months back, then drain their DRS shares later. Probably spread across say 3,000 accounts to make it seem like normal activity. * Tinfoil - operational efficiency draining from DRS non-Book shares on certain dates. * Tinfoil - possible something funny with SEC filing reported number. * There is the recent post from sister sub, google search on: Deep analysis on Computershare recurring buys reddit He examines the bi-weekly recurring Computershare buys. The bi-weekly recurring buys were around $900k to $1.5 million. An alternative DRS count estimation may be estimating money spent by retail purchasing GME per quarter. It was around $1.2 million average per 6 recurring Computershare buys per quarter. Then say a massively conservative $200k per other trading day. So: If average $1.2 million spent per bi-weekly purchase, and say $14 a share, multiply by 6 for one GME quarter: * 1,200,000 / 14 = 85,714 shares \* 6 = 514,284 shares * The 6 recurring buys alone should add 514,284 DRS shares. Other 54 trading days: * $200,000 / $14 a share = 14,285 shares a day * 54 \* 14,285 = 771,390 shares Total: 514,284 + 771,390 = +1,285,674 DRS shares a quarter --- Additional data #1: 2/23/2024 Top 50 holders from recent reddit activity: * Using sample of 653 data points (2,458,580 DRS'd shares) * Top 50 holders are 2,074,285 of the 2,458,580 DRS'd shares |Position|Number of shares| |:-|:-| |1|1,390,972| |2|70,800| |3|58,769| |4|46,518| |5|42,004| |6|38,008| |7|31,150| |8|30,701| |9|29,369| |10|22,187| |11|21,568| |12|20,000| |13|18,705| |14|14,507| |15|14,224| |16|14,220| |17|11,900| |18|10,522| |19|10,101| |20|10,085| |21|9,583| |22|9,551| |23|9,544| |24|8,500| |25|8,311| |26|8,000| |27|6,695| |28|5,860| |29|5,600| |30|5,503| |31|5,400| |32|5,362| |33|5,339| |34|5,266| |35|5,256| |36|5,213| |37|5,069| |38|4,788| |39|4,485| |40|4,420| |41|4,380| |42|4,258| |43|4,221| |44|4,216| |45|4,200| |46|3,872| |47|3,799| |48|3,772| |49|3,763| |50|3,749| 4/21/2023 List of stockholders top 25 holders (Credit: drs gme org contributors): |Position|Who|Number of shares| |:-|:-|:-| |1|Cede & Co|228,451,023.9| |2||1,200,009| |3||203,868.0026| |4||160,000| |5||146,896| |6||128,000| |7||109,812| |8||108,000| |9||108,000| |10|GameStop Omnibus Account|78,012| |11||72,000| |12||66,000| |13||65,329| |14||61,536| |15||60,140| |16||60,000| |17||60,000| |18||58,000| |19||57,884| |20||57,065.16734| |21||55,840| |22||55,479.32866| |23||53,000.09312| |24||51,600| |25||50,810.5893| 2/23/2024 Insider share count via SEC Form 4 filings: |Who|Number of shares|As of| |:-|:-|:-| |Ryan Cohen|36,847,842|6/9/2023| |Patel Nir Vinay|1,004,695|7/10/2023| |Alain Attal|562,464|9/8/2023| |Mark Robinson|68,687|1/2/2024| |Lawrence Cheng|55,088|9/8/2023| |James Grube|23,864|6/15/2023| |Daniel Moore|22,963|1/2/2024| |Xu Yang|19,860|6/15/2023| Additional data #2: Number of Computershare accounts: |Date|Number of Computershare accounts| |:-|:-| |5/8/2023|213,4xx| |8/2023 or 9/2023|213,500| |10/24/2023|216,3xx| |11/21/2023|217,xxx| |12/10/2023|218,xxx| |1/4/2024|218,4xx| Number of record holders: |Date|Source|Number of record holders| |:-|:-|:-| |3/11/2022|Form 10-K|125,543| |3/22/2023|Form 10-K|197,058| |4/21/2023|List of stockholders|197,954| GME Volume last 2 years: |Year|Volume| |:-|:-| |2022|2,825,293,700| |2023|1,167,878,465| 20 lowest volume days (as of 2/22/2024): |Rank|Date|Volume|Closing price| |:-|:-|:-|:-| |1|8/3/2023|1,318,700 |$20.93| |2|8/8/2023|1,431,300|$20.74| |3|8/10/2023|1,432,400|$20.19| |4|8/7/2023|1,441,300|$21.07| |5|7/26/2023|1,489,200|$22.70| |6|8/11/2023|1,500,200|$20.19| |7|5/9/2023|1,522,700|$20.24| |8|5/11/2023|1,652,500|$20.88| |9|1/30/2024|1,652,600|$14.55| |10|7/25/2023|1,672,000|$22.85| |11|9/27/2023|1,681,300|$17.15| |12|11/8/2023|1,705,600|$13.28| |13|2/21/2024|1,731,300|$13.41| |14|7/12/2023|1,742,200|$23.44| |15|4/13/2023|1,803,900|$22.55| |16|7/3/2023|1,806,600|$24.91| |17|2/22/2024|1,810,000|$13.36| |18|10/13/2023|1,820,565|$14.90| |19|2/8/2024|1,838,300|$14.35| |20|8/30/2023|1,884,500|$18.37|

2/16/2024 Estimated DRS count: 76,034,912 ((using today's DRSbot total + fix inadvertent DRSbot offline or resets) x 4.129) The 4.129 multiplier comes from 11/30/2023 Form 10-Q divided by DRSbot 11/30/2023 total: 75,400,000 / 18,262,331 = 4.129 Bloomberg data (to 12/9/2023), 12/31/2023 Blackrock addition, 12/29/2023 Vanguard addition, DRS estimated count, stuck in IRA estimates, and other: |Holding|Number of shares|As of| |:-|:-|:-| |Former Insiders (Other)|14,339,510|12/9/2023| |ETFs|29,950,420|12/9/2023| |MFs, Index Funds, Pension Funds, etc|36,902,186|2/13/2024| |Other Institutional Ownership|30,102,685|12/9/2023| |Insiders|38,655,910|12/9/2023| |DRS'd - 200k Computershare accounts|76,034,912|2/16/2024| |Non-DRS - 200k acct if 30% stuck in IRA|22,810,474|2/16/2024| |Non-DRS - 200k acct if 50% stuck in IRA|15,206,982|2/16/2024| |Other|41,511,236|2/16/2024| * Total Outstanding on 11/30/2023: 305,514,315 * Thank you to lawsondt for the Bloomberg data to 12/9/2023 * Vanguard increased shares by 785,823 on 12/29/2023 (2/13/2024 file date). From 24,664,433 to 25,450,256. * Blackrock increased shares by 567,123 on 12/31/2023 (1/26/2024 file date). From 21,977,404 to 22,544,527. * "Non-DRS - 200k acct if 30% stuck in IRA" is a conservative percentage. The Google share count surveys have suggested the 200k Computershare accounts have 40-50% additional shares stuck in IRAs. * "Fix inadvertent DRSbot offline or resets" is primarily whale #1's 1,390,972 DRS shares (as of 1/4/2024). Long story of switching subs and losing her DRS share count. So added the "fix inadvertent" column to capture her DRS shares. * Starting 1/4/2024, whale #1 started gift transferring DRS shares to others. 1,390,995 (on 12/25/2023) to now 1,390,972 (on 1/4/2024). Unfortunately, Computershare only allows one gift per month, and only up to $2000. Discussion points: * It seems odd on some of the DRS count fluctuations since the beginning. * There have been 2 "somewhat hidden" 2022 rugpulls (May 2022 and Aug/Sep/Oct 2022), the June 2023 Mainstar rugpull, and now the Sep/Oct/Nov 2023 rugpull. * It seems odd on recent DRS count stagnating (excluding the Mainstar rugpull of 1.27 million shares). From a very simplistic view assuming 200,000 Computershare accounts: |Buy X number of shares a month|Multiply by 3 months per quarter|Total DRS per quarter if 100,000 active accounts|Total DRS per quarter if 200,000 active accounts| |:-|:-|:-|:-| |1|3|300,000|600,000| |2|6|600,000|1,200,000| |3|9|900,000|1,800,000| |4|12|1,200,000|2,400,000| |5|15|1,500,000|3,000,000| * The April 2023 list of stockholders DRS numbers seem correct and line up with SEC filings. * Possible some investors have had to un-DRS. * Possible economic slowdown and inflation have reduced investor purchasing power. * Possible whale investors who helped inflate DRS numbers alot, have dramatically slowed down their purchasing. * Tinfoil - certain parties inflate DRS shares 9 to 18 months back, then drain their DRS shares later. Probably spread across say 3,000 accounts to make it seem like normal activity. * Tinfoil - operational efficiency draining from DRS non-Book shares on certain dates. * Tinfoil - possible something funny with SEC filing reported number. * There is the recent post from sister sub, google search on: Deep analysis on Computershare recurring buys reddit He examines the bi-weekly recurring Computershare buys. The bi-weekly recurring buys were around $900k to $1.5 million. An alternative DRS count estimation may be estimating money spent by retail purchasing GME per quarter. It was around $1.2 million average per 6 recurring Computershare buys per quarter. Then say a massively conservative $200k per other trading day. So: If average $1.2 million spent per bi-weekly purchase, and say $14 a share, multiply by 6 for one GME quarter: * 1,200,000 / 14 = 85,714 shares \* 6 = 514,284 shares * The 6 recurring buys alone should add 514,284 DRS shares. Other 54 trading days: * $200,000 / $14 a share = 14,285 shares a day * 54 \* 14,285 = 771,390 shares Total: 514,284 + 771,390 = +1,285,674 DRS shares a quarter --- Additional data: Number of Computershare accounts: |Date|Number of Computershare accounts| |:-|:-| |5/8/2023|213,4xx| |8/2023 or 9/2023|213,500| |10/24/2023|216,3xx| |11/21/2023|217,xxx| |12/10/2023|218,xxx| |1/4/2024|218,4xx| Number of record holders: |Date|Source|Number of record holders| |:-|:-|:-| |3/11/2022|Form 10-K|125,543| |3/22/2023|Form 10-K|197,058| |4/21/2023|List of stockholders|197,954| 4/21/2023 List of stockholders top 25 holders (Credit: drs gme org contributors): |Position|Who|Number of shares| |:-|:-|:-| |1|Cede & Co|228,451,023.9| |2||1,200,009| |3||203,868.0026| |4||160,000| |5||146,896| |6||128,000| |7||109,812| |8||108,000| |9||108,000| |10|GameStop Omnibus Account|78,012| |11||72,000| |12||66,000| |13||65,329| |14||61,536| |15||60,140| |16||60,000| |17||60,000| |18||58,000| |19||57,884| |20||57,065.16734| |21||55,840| |22||55,479.32866| |23||53,000.09312| |24||51,600| |25||50,810.5893| 2/7/2024 Insider share count via SEC Form 4 filings: |Who|Number of shares|As of| |:-|:-|:-| |Ryan Cohen|36,847,842|6/9/2023| |Patel Nir Vinay|1,004,695|7/10/2023| |Alain Attal|562,464|9/8/2023| |Mark Robinson|68,687|1/2/2024| |Lawrence Cheng|55,088|9/8/2023| |James Grube|23,864|6/15/2023| |Daniel Moore|22,963|1/2/2024| |Xu Yang|19,860|6/15/2023| GME Volume last 2 years: |Year|Volume| |:-|:-| |2022|2,825,293,700| |2023|1,167,878,465| 15 lowest volume days (to 2/15/2024): |Rank|Date|Volume|Closing price| |:-|:-|:-|:-| |1|8/3/2023|1,318,700 |$20.93| |2|8/8/2023|1,431,300|$20.74| |3|8/10/2023|1,432,400|$20.19| |4|8/7/2023|1,441,300|$21.07| |5|7/26/2023|1,489,200|$22.70| |6|8/11/2023|1,500,200|$20.19| |7|5/9/2023|1,522,700|$20.24| |8|5/11/2023|1,652,500|$20.88| |9|1/30/2024|1,652,600|$14.55| |10|7/25/2023|1,672,000|$22.85| |11|9/27/2023|1,681,300|$17.15| |12|11/8/2023|1,705,600|$13.28| |13|7/12/2023|1,742,200|$23.44| |14|4/13/2023|1,803,900|$22.55| |15|7/3/2023|1,806,600|$24.91|

2/2/2024 Estimated DRS count: 75,964,491 ((using today's DRSbot total + fix inadvertent DRSbot offline or resets) x 4.129) The 4.129 multiplier comes from 11/30/2023 Form 10-Q divided by DRSbot 11/30/2023 total: 75,400,000 / 18,262,331 = 4.129 Bloomberg data (to 1/26/2024), DRS estimated counts, and other: |Holding|Number of shares|As of| |:-|:-|:-| |Former Insiders (Other)|14,339,510|12/9/2023| |ETFs|29,950,420|12/9/2023| |MFs, Index Funds, Pension Funds, etc|36,116,363|1/26/2024| |Other Institutional Ownership|30,102,685|12/9/2023| |Insiders|38,655,910|12/9/2023| |DRS'd - 200k Computershare accounts|75,964,491|2/2/2024| |Non-DRS - 200k acct if 30% stuck in IRA|22,789,347|2/2/2024| |Non-DRS - 200k acct if 50% stuck in IRA|15,192,898|2/2/2024| |Other|42,402,691|2/2/2024| * Total Outstanding on 11/30/2023: 305,514,315 * Thank you to lawsondt for the Bloomberg data to 12/9/2023 * Blackrock increased shares by 567,123 on 12/31/2023 (1/26/2024 file date). From 21,977,404 to 22,544,527. * "Non-DRS - 200k acct if 30% stuck in IRA" is a conservative percentage. The Google share count surveys have suggested the 200k Computershare accounts have 40-50% additional shares stuck in IRAs. * "Fix inadvertent DRSbot offline or resets" is primarily whale #1's 1,390,972 DRS shares (as of 1/4/2024). Long story of switching subs and losing her DRS share count. So added the "fix inadvertent" column to capture her DRS shares. * Starting 1/4/2024, whale #1 started gift transferring DRS shares to others. 1,390,995 (on 12/25/2023) to now 1,390,972 (on 1/4/2024). Will continue using 1,390,995 in fix inadvertent unless those recipients feed DRSbot. Discussion points: * It seems odd on some of the DRS count fluctuations since the beginning. * There have been 2 "somewhat hidden" 2022 rugpulls (May 2022 and Aug/Sep/Oct 2022), the June 2023 Mainstar rugpull, and now the Sep/Oct/Nov 2023 rugpull. * It seems odd on recent DRS count stagnating (excluding the Mainstar rugpull of 1.27 million shares). From a very simplistic view assuming 200,000 Computershare accounts: |Buy X number of shares a month|Multiply by 3 months per quarter|Total DRS per quarter if 100,000 active accounts|Total DRS per quarter if 200,000 active accounts| |:-|:-|:-|:-| |1|3|300,000|600,000| |2|6|600,000|1,200,000| |3|9|900,000|1,800,000| |4|12|1,200,000|2,400,000| |5|15|1,500,000|3,000,000| * The April 2023 list of stockholders DRS numbers seem correct and line up with SEC filings. * Possible some investors have had to un-DRS. * Possible economic slowdown and inflation have reduced investor purchasing power. * Possible whale investors who helped inflate DRS numbers alot, have dramatically slowed down their purchasing. * Tinfoil - certain parties inflate DRS shares 9 to 18 months back, then drain their DRS shares later. Probably spread across say 3,000 accounts to make it seem like normal activity. * Tinfoil - operational efficiency draining from DRS non-Book shares on certain dates. * Tinfoil - possible something funny with SEC filing reported number. * There is the recent post from sister sub, google search on: Deep analysis on Computershare recurring buys reddit He examines the bi-weekly recurring Computershare buys. The bi-weekly recurring buys were around $900k to $1.5 million. An alternative DRS count estimation may be estimating money spent by retail purchasing GME per quarter. It was around $1.2 million average per 6 recurring Computershare buys per quarter. Then say a massively conservative $200k per other trading day. So: If average $1.2 million spent per bi-weekly purchase, and say $14 a share, multiply by 6 for one GME quarter: * 1,200,000 / 14 = 85,714 shares \* 6 = 514,284 shares * The 6 recurring buys alone should add 514,284 DRS shares. Other 54 trading days: * $200,000 / $14 a share = 14,285 shares a day * 54 \* 14,285 = 771,390 shares Total: 514,284 + 771,390 = +1,285,674 DRS shares a quarter --- Additional data: Number of Computershare accounts: |Date|Number of Computershare accounts| |:-|:-| |5/8/2023|213,4xx| |8/2023 or 9/2023|213,500| |10/24/2023|216,3xx| |11/21/2023|217,xxx| |12/10/2023|218,xxx| |1/4/2024|218,4xx| Number of record holders: |Date|Source|Number of record holders| |:-|:-|:-| |3/11/2022|Form 10-K|125,543| |3/22/2023|Form 10-K|197,058| |4/21/2023|List of stockholders|197,954| 4/21/2023 List of stockholders top 25 holders (Credit: drs gme org contributors): |Position|Who|Amount| |:-|:-|:-| |1|Cede & Co|228,451,023.9| |2||1,200,009| |3||203,868.0026| |4||160,000| |5||146,896| |6||128,000| |7||109,812| |8||108,000| |9||108,000| |10|GameStop Omnibus Account|78,012| |11||72,000| |12||66,000| |13||65,329| |14||61,536| |15||60,140| |16||60,000| |17||60,000| |18||58,000| |19||57,884| |20||57,065.16734| |21||55,840| |22||55,479.32866| |23||53,000.09312| |24||51,600| |25||50,810.5893| GME Volume last 2 years: |Year|Volume| |:-|:-| |2022|2,825,293,700| |2023|1,167,878,465| 15 lowest volume days (to 2/1/2024): |Rank|Date|Volume|Closing price| |:-|:-|:-|:-| |1|8/3/2023|1,318,700 |$20.93| |2|8/8/2023|1,431,300|$20.74| |3|8/10/2023|1,432,400|$20.19| |4|8/7/2023|1,441,300|$21.07| |5|7/26/2023|1,489,200|$22.70| |6|8/11/2023|1,500,200|$20.19| |7|5/9/2023|1,522,700|$20.24| |8|5/11/2023|1,652,500|$20.88| |9|1/30/2024|1,652,600|$14.55| |10|7/25/2023|1,672,000|$22.85| |11|9/27/2023|1,681,300|$17.15| |12|11/8/2023|1,705,600|$13.28| |13|7/12/2023|1,742,200|$23.44| |14|4/13/2023|1,803,900|$22.55| |15|7/3/2023|1,806,600|$24.91|
 lovetoburst
Now
•
100%
lovetoburst
Now
•
100%
Are you me? 😄 I was looking over the 10-Q (again) on Friday night. More of a "How is the stock price down 65% since stock split via dividend when all the SEC filing numbers are better than ever?"
We all know the answer, but I just have to remind myself.

1/26/2024 Estimated DRS count: 75,903,035 ((using today's DRSbot total + fix inadvertent DRSbot offline or resets) x 4.129) The 4.129 multiplier comes from 11/30/2023 Form 10-Q divided by DRSbot 11/30/2023 total: 75,400,000 / 18,262,331 = 4.129 Bloomberg data (to 1/26/2024), DRS estimated counts, and other: |Holding|Number of shares|As of| |:-|:-|:-| |Former Insiders (Other)|14,339,510|12/9/2023| |ETFs|29,950,420|12/9/2023| |MFs, Index Funds, Pension Funds, etc|36,116,363|1/26/2024| |Other Institutional Ownership|30,102,685|12/9/2023| |Insiders|38,655,910|12/9/2023| |DRS'd - 200k Computershare accounts|75,903,035|1/26/2024| |Non-DRS - 200k acct if 30% stuck in IRA|22,770,911|1/26/2024| |Non-DRS - 200k acct if 50% stuck in IRA|15,180,607|1/26/2024| |Other|42,494,874|1/26/2024| * Total Outstanding on 11/30/2023: 305,514,315 * Thank you to lawsondt for the Bloomberg data to 12/9/2023 * Blackrock increased shares by 567,123 on 12/31/2023 (1/26/2024 file date). From 21,977,404 to 22,544,527. * "Non-DRS - 200k acct if 30% stuck in IRA" is a conservative percentage. The Google share count surveys have suggested the 200k Computershare accounts have 40-50% additional shares stuck in IRAs. * "Fix inadvertent DRSbot offline or resets" is primarily whale #1's 1,390,972 DRS shares (as of 1/4/2024). Long story of switching subs and losing her DRS share count. So added the "fix inadvertent" column to capture her DRS shares. * Starting 1/4/2024, whale #1 started gift transferring DRS shares to others. 1,390,995 (on 12/25/2023) to now 1,390,972 (on 1/4/2024). Will continue using 1,390,995 in fix inadvertent unless those recipients feed DRSbot. Discussion points: * It seems odd on some of the DRS count fluctuations since the beginning. * There have been 2 "somewhat hidden" 2022 rugpulls (May 2022 and Aug/Sep/Oct 2022), the June 2023 Mainstar rugpull, and now the Sep/Oct/Nov 2023 rugpull. * It seems odd on recent DRS count stagnating (excluding the Mainstar rugpull of 1.27 million shares). From a very simplistic view assuming 200,000 Computershare accounts: |Buy X number of shares a month|Multiply by 3 months per quarter|Total DRS per quarter if 100,000 active accounts|Total DRS per quarter if 200,000 active accounts| |:-|:-|:-|:-| |1|3|300,000|600,000| |2|6|600,000|1,200,000| |3|9|900,000|1,800,000| |4|12|1,200,000|2,400,000| |5|15|1,500,000|3,000,000| * The April 2023 list of stockholders DRS numbers seem correct and line up with SEC filings. * Possible some investors have had to un-DRS. * Possible economic slowdown and inflation have reduced investor purchasing power. * Possible whale investors who helped inflate DRS numbers alot, have dramatically slowed down their purchasing. * Tinfoil - certain parties inflate DRS shares 9 to 18 months back, then drain their DRS shares later. Probably spread across say 3,000 accounts to make it seem like normal activity. * Tinfoil - operational efficiency draining from DRS non-Book shares on certain dates. * Tinfoil - possible something funny with SEC filing reported number. * There is the recent post from sister sub, google search on: Deep analysis on Computershare recurring buys reddit He examines the bi-weekly recurring Computershare buys. The bi-weekly recurring buys were around $900k to $1.5 million. An alternative DRS count estimation may be estimating money spent by retail purchasing GME per quarter. It was around $1.2 million average per 6 recurring Computershare buys per quarter. Then say a massively conservative $200k per other trading day. So: If average $1.2 million spent per bi-weekly purchase, and say $14 a share, multiply by 6 for one GME quarter: * 1,200,000 / 14 = 85,714 shares \* 6 = 514,284 shares * The 6 recurring buys alone should add 514,284 DRS shares. Other 54 trading days: * $200,000 / $14 a share = 14,285 shares a day * 54 \* 14,285 = 771,390 shares Total: 514,284 + 771,390 = +1,285,674 DRS shares a quarter --- Additional data: Number of Computershare accounts: |Date|Number of Computershare accounts| |:-|:-| |5/8/2023|213,4xx| |8/2023 or 9/2023|213,500| |10/24/2023|216,3xx| |11/21/2023|217,xxx| |12/10/2023|218,xxx| |1/4/2024|218,4xx| Number of record holders: |Date|Source|Number of record holders| |:-|:-|:-| |3/11/2022|Form 10-K|125,543| |3/22/2023|Form 10-K|197,058| |4/21/2023|List of stockholders|197,954| 4/21/2023 List of stockholders top 25 holders (Credit: drs gme org contributors): |Position|Who|Amount| |:-|:-|:-| |1|Cede & Co|228,451,023.9| |2||1,200,009| |3||203,868.0026| |4||160,000| |5||146,896| |6||128,000| |7||109,812| |8||108,000| |9||108,000| |10|GameStop Omnibus Account|78,012| |11||72,000| |12||66,000| |13||65,329| |14||61,536| |15||60,140| |16||60,000| |17||60,000| |18||58,000| |19||57,884| |20||57,065.16734| |21||55,840| |22||55,479.32866| |23||53,000.09312| |24||51,600| |25||50,810.5893| Recent GME Volume |Year|Volume| |:-|:-| |2022|2,825,293,700| |2023|1,167,878,465|

1/19/2024 Estimated DRS count: 75,883,224 ((using today's DRSbot total + fix inadvertent DRSbot offline or resets) x 4.129) The 4.129 multiplier comes from 11/30/2023 Form 10-Q divided by DRSbot 11/30/2023 total: 75,400,000 / 18,262,331 = 4.129 Bloomberg data (to 12/9/2023), DRS estimated counts, and other: |Holding|Number of shares|As of| |:-|:-|:-| |ETFs|29,950,420|12/9/2023| |MFs, Index Funds, Pension Funds, etc|35,549,240|12/9/2023| |Other Institutional Ownership|30,102,685|12/9/2023| |Insiders Stagnant|14,339,510|12/9/2023| |Insiders|38,655,910|12/9/2023| |DRS'd - 200k Computershare accounts|75,883,224|1/19/2024| |Non-DRS - 200k acct if 30% stuck in IRA|22,764,967|1/19/2024| |Other|58,268,359|1/19/2024| * Total Outstanding on 11/30/2023: 305,514,315 * Thank you to lawsondt for the Bloomberg data to 12/9/2023 * "Non-DRS - 200k acct if 30% stuck in IRA" is a conservative percentage. The Google share count surveys have suggested the 200k Computershare accounts have 40-50% additional shares stuck in IRAs. * "Fix inadvertent DRSbot offline or resets" is primarily whale #1's 1,390,972 DRS shares (as of 1/4/2024). Long story of switching subs and losing her DRS share count. So added the "fix inadvertent" column to capture her DRS shares. * Starting 1/4/2024, whale #1 started gift transferring DRS shares to others. 1,390,995 (on 12/25/2023) to now 1,390,972 (on 1/4/2024). Will continue using 1,390,995 in fix inadvertent unless those recipients feed DRSbot. Discussion points: * It seems odd on some of the DRS count fluctuations since the beginning. * There have been 2 "somewhat hidden" 2022 rugpulls (May 2022 and Aug/Sep/Oct 2022), the June 2023 Mainstar rugpull, and now the Sep/Oct/Nov 2023 rugpull. * It seems odd on recent DRS count stagnating (excluding the Mainstar rugpull of 1.27 million shares). From a very simplistic view assuming 200,000 Computershare accounts: |Buy X number of shares a month|Multiply by 3 months per quarter|Total DRS per quarter if 100,000 active accounts|Total DRS per quarter if 200,000 active accounts| |:-|:-|:-|:-| |1|3|300,000|600,000| |2|6|600,000|1,200,000| |3|9|900,000|1,800,000| |4|12|1,200,000|2,400,000| |5|15|1,500,000|3,000,000| * The April 2023 list of stockholders DRS numbers seem correct and line up with SEC filings. * Possible some investors have had to un-DRS. * Possible economic slowdown and inflation have reduced investor purchasing power. * Possible whale investors who helped inflate DRS numbers alot, have dramatically slowed down their purchasing. * Tinfoil - certain parties inflate DRS shares 9 to 18 months back, then drain their DRS shares later. Probably spread across say 3,000 accounts to make it seem like normal activity. * Tinfoil - operational efficiency draining from DRS non-Book shares on certain dates. * Tinfoil - possible something funny with SEC filing reported number. * There is the recent post from sister sub, google search on: Deep analysis on Computershare recurring buys reddit He examines the bi-weekly recurring Computershare buys. The bi-weekly recurring buys were around $900k to $1.5 million. An alternative DRS count estimation may be estimating money spent by retail purchasing GME per quarter. It was around $1.2 million average per 6 recurring Computershare buys per quarter. Then say a massively conservative $200k per other trading day. So: If average $1.2 million spent per bi-weekly purchase, and say $14 a share, multiply by 6 for one GME quarter: * 1,200,000 / 14 = 85,714 shares \* 6 = 514,284 shares * The 6 recurring buys alone should add 514,284 DRS shares. Other 54 trading days: * $200,000 / $14 a share = 14,285 shares a day * 54 \* 14,285 = 771,390 shares Total: 514,284 + 771,390 = +1,285,674 DRS shares a quarter

1/12/2024 Estimated DRS count: 75,831,798 ((using today's DRSbot total + fix inadvertent DRSbot offline or resets) x 4.129) The 4.129 multiplier comes from 11/30/2023 Form 10-Q divided by DRSbot 11/30/2023 total: 75,400,000 / 18,262,331 = 4.129 Bloomberg data (to 12/9/2023), DRS estimated counts, and other: |Holding|Number of shares|As of| |:-|:-|:-| |ETFs|29,950,420|12/9/2023| |MFs, Index Funds, Pension Funds, etc|35,549,240|12/9/2023| |Other Institutional Ownership|30,102,685|12/9/2023| |Insiders Stagnant|14,339,510|12/9/2023| |Insiders|38,655,910|12/9/2023| |DRS'd - 200k Computershare accounts|75,831,798|1/12/2024| |Non-DRS - 200k acct if 25% stuck in IRA|18,957,950|1/12/2024| |Other|62,126,802|1/12/2024| * Total Outstanding on 11/30/2023: 305,514,315 * Thank you to lawsondt for the Bloomberg data to 12/9/2023 * "Non-DRS - 200k acct if 25% stuck in IRA" is a conservative percentage. The Google share count surveys have suggested the 200k Computershare accounts have 40-50% additional shares stuck in IRAs. * "Fix inadvertent DRSbot offline or resets" is primarily whale #1's 1,390,972 DRS shares (as of 1/4/2024). Long story of switching subs and losing her DRS share count. So added the "fix inadvertent" column to capture her DRS shares. * Starting 1/4/2024, whale #1 started gift transferring DRS shares to others. 1,390,995 (on 12/25/2023) to now 1,390,972 (on 1/4/2024). Will continue using 1,390,995 in fix inadvertent unless those recipients feed DRSbot. Discussion points: * It seems odd on some of the DRS count fluctuations since the beginning. * There have been 2 "somewhat hidden" 2022 rugpulls (May 2022 and Aug/Sep/Oct 2022), the June 2023 Mainstar rugpull, and now the Sep/Oct/Nov 2023 rugpull. * It seems odd on recent DRS count stagnating (excluding the Mainstar rugpull of 1.27 million shares). From a very simplistic view assuming 200,000 Computershare accounts: |Buy X number of shares a month|Multiply by 3 months per quarter|Total DRS per quarter if 100,000 active accounts|Total DRS per quarter if 200,000 active accounts| |:-|:-|:-|:-| |1|3|300,000|600,000| |2|6|600,000|1,200,000| |3|9|900,000|1,800,000| |4|12|1,200,000|2,400,000| |5|15|1,500,000|3,000,000| * The April 2023 list of stockholders DRS numbers seem correct and line up with SEC filings. * Possible some investors have had to un-DRS. * Possible economic slowdown and inflation have reduced investor purchasing power. * Possible whale investors who helped inflate DRS numbers alot, have dramatically slowed down their purchasing. * Tinfoil - certain parties inflate DRS shares 9 to 18 months back, then drain their DRS shares later. Probably spread across say 3,000 accounts to make it seem like normal activity. * Tinfoil - operational efficiency draining from DRS non-Book shares on certain dates. * Tinfoil - possible something funny with SEC filing reported number. * There is the recent post from sister sub, google search on: Deep analysis on Computershare recurring buys reddit He examines the bi-weekly recurring Computershare buys. The bi-weekly recurring buys were around $900k to $1.5 million. An alternative DRS count estimation may be estimating money spent by retail purchasing GME per quarter. It was around $1.2 million average per 6 recurring Computershare buys per quarter. Then say a massively conservative $200k per other trading day. So: If average $1.2 million spent per bi-weekly purchase, and say $14 a share, multiply by 6 for one GME quarter: * 1,200,000 / 14 = 85,714 shares \* 6 = 514,284 shares * The 6 recurring buys alone should add 514,284 DRS shares. Other 54 trading days: * $200,000 / $14 a share = 14,285 shares a day * 54 \* 14,285 = 771,390 shares Total: 514,284 + 771,390 = +1,285,674 DRS shares a quarter

1/5/2024 Estimated DRS count: 75,793,468 ((using today's DRSbot total + fix inadvertent DRSbot offline or resets) x 4.129) The 4.129 multiplier comes from 11/30/2023 Form 10-Q divided by DRSbot 11/30/2023 total: 75,400,000 / 18,262,331 = 4.129 Bloomberg data (to 12/9/2023), DRS estimated counts, and other: |Holding|Number of shares|As of| |:-|:-|:-| |ETFs|29,950,420|12/9/2023| |MFs, Index Funds, Pension Funds, etc|35,549,240|12/9/2023| |Other Institutional Ownership|30,102,685|12/9/2023| |Insiders Stagnant|14,339,510|12/9/2023| |Insiders|38,655,910|12/9/2023| |DRS'd - 200k Computershare accounts|75,793,468|1/5/2024| |Non-DRS - 200k acct 25% stuck in IRA|18,948,367|1/5/2024| |Other|62,174,715|1/5/2024| * Total Outstanding on 11/30/2023: 305,514,315 * Thank you to lawsondt for the Bloomberg data to 12/9/2023 * "Non-DRS - 200k acct 25% stuck in IRA" is a conservative percentage. The Google share count surveys have suggested the 200k Computershare accounts have 30-40% additional shares stuck in IRAs. * "Fix inadvertent DRSbot offline or resets" is primarily whale #1's 1,390,972 DRS shares (as of 1/4/2024). Long story of switching subs and losing her DRS share count. So added the "fix inadvertent" column to capture her DRS shares. * Starting 1/4/2024, whale #1 started gift transferring DRS shares to others. 1,390,995 (on 12/25/2023) to now 1,390,972 (on 1/4/2024). Will continue using 1,390,995 in fix inadvertent unless those recipients feed DRSbot. Discussion points: * It seems odd on some of the DRS count fluctuations since the beginning. * There have been 2 "somewhat hidden" 2022 rugpulls (May 2022 and Aug/Sep/Oct 2022), the June 2023 Mainstar rugpull, and now the Sep/Oct/Nov 2023 rugpull. * It seems odd on recent DRS count stagnating (excluding the Mainstar rugpull of 1.27 million shares). From a very simplistic view assuming 200,000 Computershare accounts: |Buy X number of shares a month|Multiply by 3 months per quarter|Total DRS per quarter if 100,000 active accounts|Total DRS per quarter if 200,000 active accounts| |:-|:-|:-|:-| |1|3|300,000|600,000| |2|6|600,000|1,200,000| |3|9|900,000|1,800,000| |4|12|1,200,000|2,400,000| |5|15|1,500,000|3,000,000| * The April 2023 list of stockholders DRS numbers seem correct and line up with SEC filings. * Possible some investors have had to un-DRS. * Possible economic slowdown and inflation have reduced investor purchasing power. * Possible whale investors who helped inflate DRS numbers alot, have dramatically slowed down their purchasing. * Tinfoil - certain parties inflate DRS shares 9 to 18 months back, then drain their DRS shares later. Probably spread across say 3,000 accounts to make it seem like normal activity. * Tinfoil - operational efficiency draining from DRS non-Book shares on certain dates. * Tinfoil - possible something funny with SEC filing reported number. * There is the recent post from sister sub, google search on: Deep analysis on Computershare recurring buys reddit He examines the bi-weekly recurring Computershare buys. The bi-weekly recurring buys were around $900k to $1.5 million. An alternative DRS count estimation may be estimating money spent by retail purchasing GME per quarter. It was around $1.2 million average per 6 recurring Computershare buys per quarter. Then say a massively conservative $200k per other trading day. So: If average $1.2 million spent per bi-weekly purchase, and say $14 a share, multiply by 6 for one GME quarter: * 1,200,000 / 14 = 85,714 shares \* 6 = 514,284 shares * The 6 recurring buys alone should add 514,284 DRS shares. Other 54 trading days: * $200,000 / $14 a share = 14,285 shares a day * 54 \* 14,285 = 771,390 shares Total: 514,284 + 771,390 = +1,285,674 DRS shares a quarter

12/29/2023 Estimated DRS count: 75,770,775 ((using today's DRSbot total + fix inadvertent DRSbot offline or resets) x 4.129) The 4.129 multiplier comes from 11/30/2023 Form 10-Q divided by DRSbot 11/30/2023 total: 75,400,000 / 18,262,331 = 4.129 Bloomberg data (to 12/9/2023), DRS estimated counts, and other: |Holding|Number of shares|As of| |:-|:-|:-| |ETFs|29,950,420|12/9/2023| |MFs, Index Funds, Pension Funds, etc|35,549,240|12/9/2023| |Other Institutional Ownership|30,102,685|12/9/2023| |Insiders Stagnant|14,339,510|12/9/2023| |Insiders|38,655,910|12/9/2023| |DRS'd - 200k Computershare accounts|75,770,775|12/29/2023| |Non-DRS - 200k acct 25% stuck in IRA|18,942,694|12/29/2023| |Other|62,203,081|12/29/2023| * Total Outstanding on 11/30/2023: 305,514,315 * Thank you to lawsondt for the Bloomberg data to 12/9/2023 * "Non-DRS - 200k acct 25% stuck in IRA" is a conservative percentage. The Google share count surveys have suggested the 200k Computershare accounts have 30-40% additional shares stuck in IRAs. * "Fix inadvertent DRSbot offline or resets" is primarily whale #1's 1,390,995 DRS shares (as of 12/25/2023). Long story of switching subs and losing her DRS share count. So added the "fix inadvertent" column to capture her DRS shares. Discussion points: * It seems odd on some of the DRS count fluctuations since the beginning. * There have been 2 "somewhat hidden" 2022 rugpulls (May 2022 and Aug/Sep/Oct 2022), the June 2023 Mainstar rugpull, and now the Sep/Oct/Nov 2023 rugpull. * It seems odd on recent DRS count stagnating (excluding the Mainstar rugpull of 1.27 million shares). From a very simplistic view assuming 200,000 Computershare accounts: |Buy X number of shares a month|Multiply by 3 months per quarter|Total DRS per quarter if 100,000 active accounts|Total DRS per quarter if 200,000 active accounts| |:-|:-|:-|:-| |1|3|300,000|600,000| |2|6|600,000|1,200,000| |3|9|900,000|1,800,000| |4|12|1,200,000|2,400,000| |5|15|1,500,000|3,000,000| * The April 2023 list of stockholders DRS numbers seem correct and line up with SEC filings. * Possible some investors have had to un-DRS. * Possible economic slowdown and inflation have reduced investor purchasing power. * Possible whale investors who helped inflate DRS numbers alot, have dramatically slowed down their purchasing. * Tinfoil - certain parties inflate DRS shares 9 to 18 months back, then drain their DRS shares later. Probably spread across say 3,000 accounts to make it seem like normal activity. * Tinfoil - operational efficiency draining from DRS non-Book shares on certain dates. * Tinfoil - possible something funny with SEC filing reported number. * There is the recent post from sister sub, google search on: Deep analysis on Computershare recurring buys reddit He examines the bi-weekly recurring Computershare buys. The bi-weekly recurring buys were around $900k to $1.5 million. An alternative DRS count estimation may be estimating money spent by retail purchasing GME per quarter. It was around $1.2 million average per 6 recurring Computershare buys per quarter. Then say a massively conservative $200k per other trading day. So: If average $1.2 million spent per bi-weekly purchase, and say $14 a share, multiply by 6 for one GME quarter: * 1,200,000 / 14 = 85,714 shares \* 6 = 514,284 shares * The 6 recurring buys alone should add 514,284 DRS shares. Other 54 trading days: * $200,000 / $14 a share = 14,285 shares a day * 54 \* 14,285 = 771,390 shares Total: 514,284 + 771,390 = +1,285,674 DRS shares a quarter

12/22/2023 Estimated DRS count: 75,744,118 ((using today's DRSbot total + fix inadvertent DRSbot offline or resets) x 4.129) The 4.129 multiplier comes from 11/30/2023 Form 10-Q divided by DRSbot 11/30/2023 total: 75,400,000 / 18,262,331 = 4.129 Bloomberg data (to 12/9/2023), DRS estimated counts, and other: |Holding|Number of shares|As of| |:-|:-|:-| |ETFs|29,950,420|12/9/2023| |MFs, Index Funds, Pension Funds, etc|35,549,240|12/9/2023| |Other Institutional Ownership|30,102,685|12/9/2023| |Insiders Stagnant|14,339,510|12/9/2023| |Insiders|38,655,910|12/9/2023| |DRS'd - 200k Computershare accounts|75,744,118|12/22/2023| |Non-DRS - 200k acct 25% stuck in IRA|18,936,030|12/22/2023| |Other|62,236,402|12/22/2023| * Total Outstanding on 11/30/2023: 305,514,315 * Thank you to lawsondt for the Bloomberg data to 12/9/2023 * "Non-DRS - 200k acct 25% stuck in IRA" is a conservative percentage. The Google share count surveys have suggested the 200k Computershare accounts have 30-40% additional shares stuck in IRAs. * "Fix inadvertent DRSbot offline or resets" is primarily whale #1's 1,389,665 DRS shares (as of 11/21/2023). Long story of switching subs and losing their DRS share count. So added the "fix inadvertent" column to capture their DRS shares. Discussion points: * It seems odd on some of the DRS count fluctuations since the beginning. * There have been 2 "somewhat hidden" 2022 rugpulls (May 2022 and Aug/Sep/Oct 2022), the June 2023 Mainstar rugpull, and now the Sep/Oct/Nov 2023 rugpull. * It seems odd on recent DRS count stagnating (excluding the Mainstar rugpull of 1.27 million shares). From a very simplistic view assuming 200,000 Computershare accounts: |Buy X number of shares a month|Multiply by 3 months per quarter|Total DRS per quarter if 100,000 active accounts|Total DRS per quarter if 200,000 active accounts| |:-|:-|:-|:-| |1|3|300,000|600,000| |2|6|600,000|1,200,000| |3|9|900,000|1,800,000| |4|12|1,200,000|2,400,000| |5|15|1,500,000|3,000,000| * The April 2023 list of stockholders DRS numbers seem correct and line up with SEC filings. * Possible some investors have had to un-DRS. * Possible economic slowdown and inflation have reduced investor purchasing power. * Possible whale investors who helped inflate DRS numbers alot, have dramatically slowed down their purchasing. * Tinfoil - forces inflate DRS shares 9 to 18 months back, then drain their DRS shares later. Probably spread across say 3,000 accounts to make it seem like normal activity. * Tinfoil - operational efficiency draining from DRS non-Book shares on certain dates. * Tinfoil - possible something funny with SEC filing reported number. * There is the recent post from sister sub, google search on: Deep analysis on Computershare recurring buys reddit He examines the bi-weekly recurring Computershare buys. The bi-weekly recurring buys were around $900k to $1.5 million. An alternative DRS count estimation may be estimating money spent by retail purchasing GME per quarter. It was around $1.2 million average per 6 recurring Computershare buys per quarter. Then say a massively conservative $200k per other trading day. So: If average $1.2 million spent per bi-weekly purchase, and say $14 a share, multiply by 6 for one GME quarter: * 1,200,000 / 14 = 85,714 shares \* 6 = 514,284 shares * The 6 recurring buys alone should add 514,284 DRS shares. Other 54 trading days: * $200,000 / $14 a share = 14,285 shares a day * 54 \* 14,285 = 771,390 shares Total: 514,284 + 771,390 = +1,285,674 DRS shares a quarter

12/15/2023 Estimated DRS count: 75,632,033 ((using today's DRSbot total + fix inadvertent DRSbot offline or resets) x 4.129) The 4.129 multiplier comes from 11/30/2023 Form 10-Q divided by DRSbot 11/30/2023 total: 75,400,000 / 18,262,331 = 4.129 Bloomberg data (to 12/9/2023), DRS estimated counts, and other: |Holding|Number of shares|As of| |:-|:-|:-| |ETFs|29,950,420|12/9/2023| |MFs, Index Funds, Pension Funds, etc|35,549,240|12/9/2023| |Other Institutional Ownership|30,102,685|12/9/2023| |Insiders Stagnant|14,339,510|12/9/2023| |Insiders|38,655,910|12/9/2023| |DRS'd - 200k Computershare accounts|75,632,033|12/15/2023| |Non-DRS - 200k acct 25% stuck in IRA|18,908,008|12/15/2023| |Other|62,376,509|12/15/2023| * Total Outstanding on 11/30/2023: 305,514,315 (10/12/2023 was 305,241,294) * Thank you to lawsondt for the Bloomberg data to 12/9/2023 * "Non-DRS - 200k acct 25% stuck in IRA" is a conservative percentage. The Google share count surveys have suggested the 200k Computershare accounts have 30-40% additional shares stuck in IRAs. * "Fix inadvertent DRSbot offline or resets" is primarily whale #1's 1,389,665 DRS shares (as of 11/21/2023). Long story of switching subs and losing their DRS share count. So added the "fix inadvertent" column to capture their DRS shares. Discussion points: * It seems odd on some of the DRS count fluctuations since the beginning. * There have been 2 "somewhat hidden" 2022 rugpulls (May 2022 and Aug/Sep/Oct 2022), the June 2023 Mainstar rugpull, and now the Sep/Oct/Nov 2023 rugpull. * It seems odd on recent DRS count stagnating (excluding the Mainstar rugpull of 1.27 million shares). From a very simplistic view assuming 200,000 Computershare accounts: |Buy X number of shares a month|Multiply by 3 months per quarter|Total DRS per quarter if 100,000 active accounts|Total DRS per quarter if 200,000 active accounts| |:-|:-|:-|:-| |1|3|300,000|600,000| |2|6|600,000|1,200,000| |3|9|900,000|1,800,000| |4|12|1,200,000|2,400,000| |5|15|1,500,000|3,000,000| * The April 2023 List of stockholders DRS numbers seem correct and line up with SEC filings. * Possible some investors have had to un-DRS. * Possible economic slowdown and inflation have reduced investor purchasing power. * Possible whale investors who helped inflate DRS numbers alot, have dramatically slowed down their purchasing. * Tinfoil - forces inflate DRS shares 9 to 18 months back, then drain their DRS shares later. Probably spread across say 3,000 accounts to make it seem like normal activity. * Tinfoil - operational efficiency draining from DRS non-Book shares on certain dates. * Tinfoil - possible something funny with SEC filing reported number. * There is the recent post from sister sub, google search on: Deep analysis on Computershare recurring buys reddit He examines the bi-weekly recurring Computershare buys. The bi-weekly recurring buys were around $900k to $1.5 million. An alternative DRS count estimation may be estimating money spent by retail purchasing GME per quarter. It was around $1.2 million average per 6 recurring Computershare buys per quarter. Then say a massively conservative $200k per other trading day. So: If average $1.2 million spent per bi-weekly purchase, and say $14 a share, multiply by 6 for one GME quarter: * 1,200,000 / 14 = 85,714 shares \* 6 = 514,284 shares * The 6 recurring buys alone should add 514,284 DRS shares. Other 54 trading days: * $200,000 / $14 a share = 14,285 shares a day * 54 \* 14,285 = 771,390 shares Total: 514,284 + 771,390 = +1,285,674 DRS shares a quarter

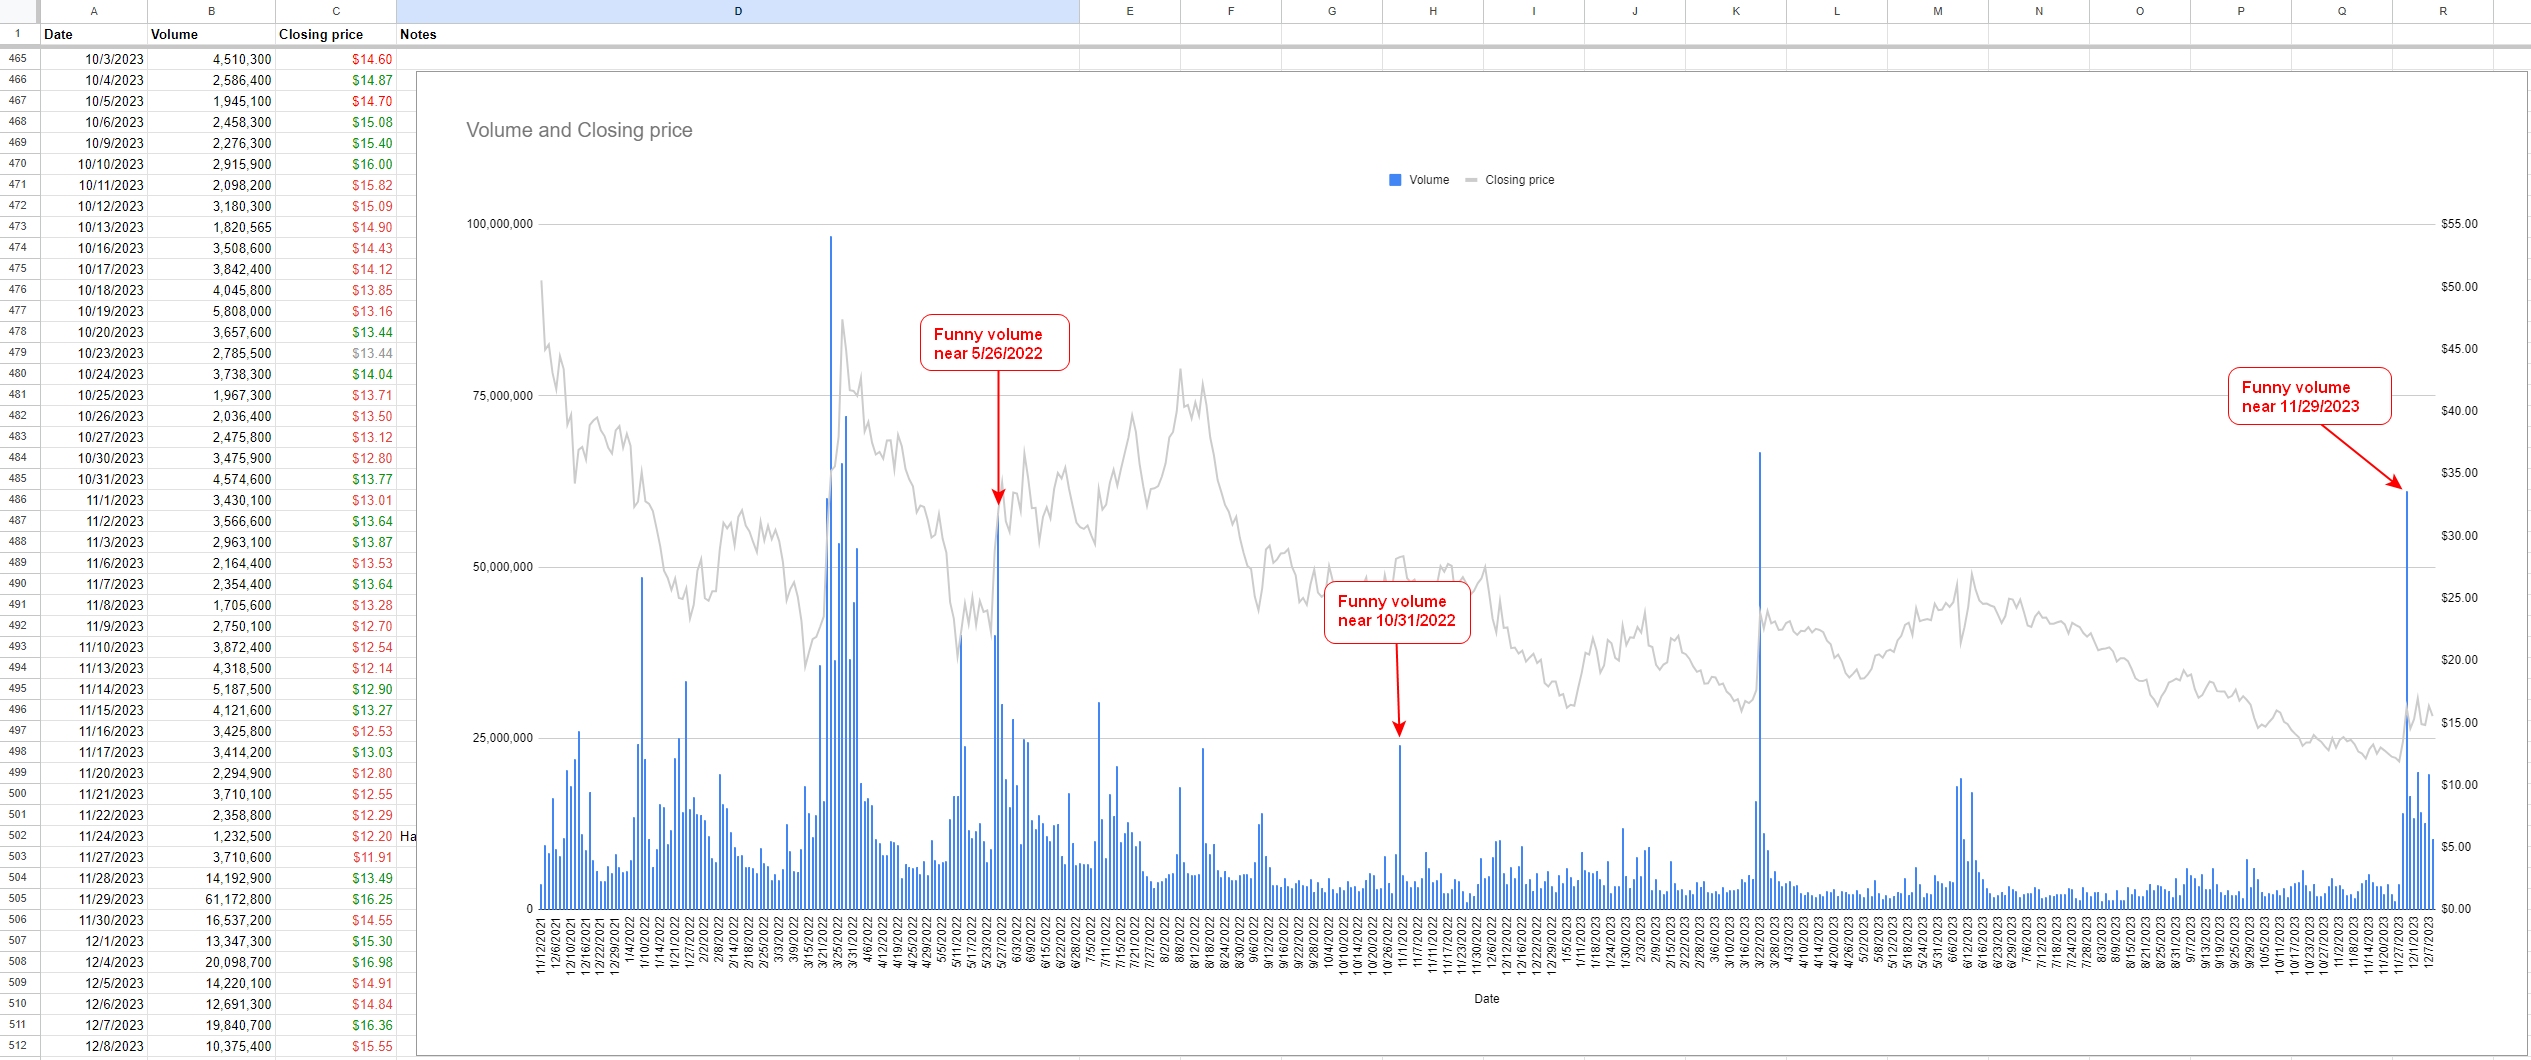 2022 negative DRS counts get overlooked sometimes. Where the DRS count going negative during a quarter is somewhat hidden. * Between 4/30/2022 and 5/26/2022 the DRS count went -3,783,592 shares * Somewhat hidden as it is an unofficial SEC filing DRS count. It was the first visit to GameStop HQ to view the list of stockholders. * Sometime Aug/Sep/Oct 2022 DRS count went -700,012 shares * Somewhat hidden as the positive offset was due to whale #1. Whale #1 prevented the DRS count going negative when their 1.2 million DRS completed mid-August 2022. |Date|DRS count|Source|DRS shares drained| |:-|:-|:-|:-| |10/30/2021|20,800,000|Form 10-Q|| |1/29/2022|35,600,000|Form 10-K|| |4/30/2022|50,800,000|Form 10-Q|| |5/26/2022|47,016,408|List of stockholders|Yes. Funny volume surrounding 5/26/2022| |7/30/2022|71,300,000|Form 10-Q|| |8/15/2022|72,500,012|Whale #1 DRS'd 1,200,012 shares|Yes - draining occurred sometime in Aug, Sep, and/or Oct 2022. Whale #1's DRS prevented the official DRS count being negative this quarter.| |10/29/2022|71,800,000|Form 10-Q|Funny volume surrounding 10/31/2022| |3/22/2023|76,000,000|Form 10-K|| |4/21/2023|76,265,982|List of stockholders|| |6/1/2023|76,600,000|Form 10-Q|| |6/20/2023|75,329,434|Mainstar rugpull -1,270,566|Yes| |8/31/2023|75,400,000|Form 10-Q|| |11/30/2023|75,400,000|Form 10-Q|Yes - draining occurred sometime in Sep, Oct, and/or Nov 2023. Funny volume surrounding 11/29/2023| Tinfoil thoughts as we do not have access to see daily changes in the list of stockholders, otherwise we could see if some accounts are draining on certain days. * Tinfoil - forces inflate DRS shares 9 to 18 months back, then drain their DRS shares later. Probably spread across say 3,000 accounts to make it seem like normal activity. * Tinfoil - operational efficiency draining from DRS non-Book shares on certain dates.
redditor iamthinksnow with the 218,xxx high score. Via https://www.reddit.com/r/Superstonk/comments/18fdw5a/drs_400_again_and_again_and_again_i_didnt_hear_no/ |Date|Computershare Accounts| |:-|:-| |5/8/2023|213,4xx| |8/2023 or 9/2023|213,500| |10/24/2023|216,3xx| |11/21/2023|217,xxx| |12/10/2023|218,xxx|
lovetoburst
Now
•
100%
Sorry, don't have a source on that. Scrolled a million bananas on reddit this year and everything is a blur. :)
I'm assuming DTCC just watches Computershare's broker for Computershare's transactions. Doubt they would ever contact Computershare and leave a trail.
lovetoburst
Now
•
100%
Check out TheUltimator5's posts on recurring buy fills: https://www.reddit.com/user/theultimator5/
I think 6days1week had the Computershare recurring buy dates marked on a calendar, or maybe TheUltimator5 mentions in one of his posts.
I used the most basic average $1.2 million buy every 2 weeks and used only $14 a share as an example. So 85,714 shares * 6 times a quarter = 514,284 shares from just recurring buys each quarter. Mileage will vary of course on GME share price at the time.
I think the DTCC side can see all broker transactions.
- Computershare's bi-weekly recurring and daily purchases go through a broker.
- Broker DRS transfers to Computershare notify the DTCC that a stock withdrawal is taking place.
- I think I saw a redditor mention a rule/agreement that the DTCC can ask to see a transfer agent's books at any time, too.
lovetoburst
Now
•
100%
The DRS count incrementing 76.0m > 76.26m > 76.6m seems "ok, no 'major' f--kery" but still a bit on the low side. Which partly leads to questioning if we are overestimating retail investor purchasing power and how many are DRS-ing in that timeframe.
Without access to the Computershare dashboard to see daily account and count changes, we're left in the dark guessing. Like the +4.2m for 3/22/2023 versus +.5m on 10/29/2022. One theory is "they" load up DRS accounts, then many months later drain shares to confuse retail.
lovetoburst
Now
•
100%
Yeah, I wish the default Lemmy editor included tables like reddit's Fancy editor. I copy-paste from my reddit post (in Markdown mode) and it preserves the tables over in Lemmy.
lovetoburst
Now
•
100%
Thank you, adding inflation for next week's post.
Short version: |Date|DRS count|Source| |:-|:-|:-| |10/30/2021|20,800,000|Form 10-Q| |1/29/2022|35,600,000|Form 10-K| |4/30/2022|50,800,000|Form 10-Q| |5/26/2022|47,016,408|List of stockholders| |7/30/2022|71,300,000|Form 10-Q| |8/15/2022|72,500,012|Whale #1 DRS'd 1,200,012 shares| |10/29/2022|71,800,000|Form 10-Q| |3/22/2023|76,000,000|Form 10-K| |4/21/2023|76,265,982|List of stockholders| |6/1/2023|76,600,000|Form 10-Q| |6/20/2023|75,329,434|Mainstar rugpull -1,270,566| |8/31/2023|75,400,000|Form 10-Q| |11/30/2023|75,400,000|Form 10-Q| Long version: |Date|Shares|Comparing to previous date|Filing Notes| |:-|:-|:-|:-| |10/30/2021 10-Q|5,200,000 (x4 = 20,800,000 DRS)||"As of October 30, 2021, 5.2 million shares ... were directly registered with our transfer agent, ComputerShare."| |1/29/2022 10-K|8,900,000 (x4 = 35,600,000 DRS)|\+14,800,000 DRS over 91 days|"As of January 29, 2022, 8.9 million shares ... were directly registered with our transfer agent, ComputerShare."| |4/30/2022 10-Q|12,700,000 (x4 = 50,800,000 DRS)|\+15,200,000 DRS over 91 days|"As of April 30, 2022, 12.7 million shares ... were directly registered with our transfer agent."| |5/26/2022 list of stockholders|Total shares: 76,129,034 (x4 = 304,516,136) !! Owned by Cede: 64,374,932 (x4 = 257,499,728) !! Implied Non-Cede: 11,754,102 (x4 = 47,016,408 DRS)|\-3,783,592 DRS over 26 days|| |7/30/2022 10-Q|71,300,000 DRS|\+24,283,592 DRS from 5/26/2022 list of shareholders (over 65 days) or +20,500,000 DRS from 4/30/2022 10-Q (over 91 days)|"As of July 30, 2022, 71.3 million shares ... were directly registered with our transfer agent."| |8/15/2022 Whale #1 DRS'd 1,200,012 shares|72,500,012 DRS||| |10/29/2022 10-Q|71,800,000 DRS|\+500,000 DRS over 91 days (5,494 per day)|"As of October 29, 2022, 71.8 million shares ... were directly registered with our transfer agent."| |3/22/2023 10-K|Owned by Cede: \~228,700,000 !! Non-Cede: \~76,000,000 DRS|\+4,200,000 DRS over 144 days (29,166 per day)|"Excluding the approximately 228.7 million shares ... held by Cede & Co on behalf of the Depository Trust & Clearing Corporation, approximately 76.0 million shares of ... were held by record holders as of March 22, 2023."| |4/21/2023 list of stockholders|Total shares: 304,717,022 !! Owned by Cede: 228,451,023.9 (+16) !! Non-Cede shares: 76,265,982.1 DRS|\+265,982 DRS over 30 days (8,866 per day)|| |6/1/2023 10-Q|Owned by Cede: \~228,100,000 !! Non-Cede: \~76,600,000 DRS|\+334,018 DRS over 41 days (8,146 per day)|"Of those outstanding shares, approximately 228.1 million were held by Cede & Co on behalf of the Depository Trust & Clearing Corporation and approximately 76.6 million shares ... were held by registered holders with our transfer agent as of June 1, 2023."| |6/20/2023 Mainstar rugpull|Minus 1,270,566 DRS shares||| |8/31/2023 10-Q|Owned by Cede: \~229,800,000 !! Non-Cede: \~75,400,000 DRS|\-1,200,000 DRS over 91 days|"Of those outstanding shares, approximately 229.8 million were held by Cede & Co on behalf of the Depository Trust & Clearing Corporation and approximately 75.4 million shares ... were held by registered holders with our transfer agent as of August 31, 2023."| |11/30/2023 10-Q|Total shares: 305,514,315 !! Owned by Cede: \~230,100,000 !! Non-Cede shares: \~75,400,000 DRS|0 DRS over 91 days|"Of those outstanding shares, approximately 230.1 million were held by Cede & Co on behalf of the Depository Trust & Clearing Corporation and approximately 75.4 million shares ... were held by registered holders with our transfer agent as of November 30, 2023."| Discussion points: * It seems "odd" on some of the DRS count fluctuations since the beginning. * There have been 2 "somewhat hidden" 2022 rugpulls (May 2022 and Aug/Sep/Oct 2022), the June 2023 Mainstar rugpull, and now the Sep/Oct/Nov 2023 rugpull. * It seems "odd" on recent DRS count stagnating (excluding the Mainstar rugpull of 1.27 million shares). From a very simplistic view assuming 200,000 Computershare accounts: |Buy X number of shares a month|Multiply by 3 months per quarter|Total DRS per quarter if 100,000 active accounts|Total DRS per quarter if 200,000 active accounts| |:-|:-|:-|:-| |1|3|300,000|600,000| |2|6|600,000|1,200,000| |3|9|900,000|1,800,000| |4|12|1,200,000|2,400,000| |5|15|1,500,000|3,000,000| * The April 2023 List of stockholders DRS numbers seem correct and line up with SEC filings. * Possible some investors have had to un-DRS. * Possible economic slowdown has reduced investor purchasing power. * Whale investors who helped inflate DRS numbers alot, have dramatically slowed down their purchasing. * Tinfoil - forces inflate DRS shares 9 to 18 months back, then drain their DRS shares later. Probably spread across say 3,000 accounts to make it seem like normal activity. * Tinfoil - operational efficiency draining from DRS non-Book shares on certain dates. * Tinfoil - possible something funny with SEC filing reported number.

12/8/2023 Estimated DRS count: 75,532,193 ((using today's DRSbot total + fix inadvertent DRSbot offline or resets) x 4.129) The 4.129 multiplier comes from 11/30/2023 Form 10-Q divided by DRSbot 11/30/2023 total: 75,400,000 / 18,262,331 = 4.129 Bloomberg data (to 9/11/2023), DRS estimated counts, and other: |Holding|Number of shares|As of| |:-|:-|:-| |ETFs|29,138,064|9/8/2023| |MFs, Index Funds, Pension Funds, etc|33,999,059|9/8/2023| |Other Institutional Ownership|32,373,815|9/8/2023| |Insiders Stagnant|14,339,510|9/8/2023| |Insiders|38,540,578|9/11/2023| |DRS'd - 200k Computershare accounts|75,532,193|12/8/2023| |Non-DRS - 200k acct 25% stuck in IRA|18,883,048|12/8/2023| |Other|62,708,048|12/8/2023| * Total Outstanding on 11/30/2023: 305,514,315 (10/12/2023 was 305,241,294) * Thank you to lawsondt for the Bloomberg data to 9/8/2023. * "Non-DRS - 200k acct 25% stuck in IRA" is a conservative percentage. The Google share count surveys have suggested the 200k Computershare accounts have 30-40% additional shares stuck in IRAs. * "Fix inadvertent DRSbot offline or resets" is primarily whale #1's 1,389,665 DRS shares (as of 11/21/2023). Long story of switching subs and losing their DRS share count. So added the "fix inadvertent" column to capture their DRS shares. Discussion points: * It seems odd on some of the DRS count fluctuations since the beginning. * There have been 2 "somewhat hidden" 2022 rugpulls (May 2022 and Aug/Sep/Oct 2022), the June 2023 Mainstar rugpull, and now the Sep/Oct/Nov 2023 rugpull. * It seems odd on recent DRS count stagnating (excluding the Mainstar rugpull of 1.27 million shares). From a very simplistic view assuming 200,000 Computershare accounts: |Buy X number of shares a month|Multiply by 3 months per quarter|Total DRS per quarter if 100,000 active accounts|Total DRS per quarter if 200,000 active accounts| |:-|:-|:-|:-| |1|3|300,000|600,000| |2|6|600,000|1,200,000| |3|9|900,000|1,800,000| |4|12|1,200,000|2,400,000| |5|15|1,500,000|3,000,000| * The April 2023 List of stockholders DRS numbers seem correct and line up with SEC filings. * Possible some investors have had to un-DRS. * Possible economic slowdown has reduced investor purchasing power. * Possible whale investors who helped inflate DRS numbers alot, have dramatically slowed down their purchasing. * Tinfoil - forces inflate DRS shares 9 to 18 months back, then drain their DRS shares later. Probably spread across say 3,000 accounts to make it seem like normal activity. * Tinfoil - operational efficiency draining from DRS non-Book shares on certain dates. * Tinfoil - possible something funny with SEC filing reported number. * There is the recent post from sister sub, google search on: Deep analysis on Computershare recurring buys reddit He examines the bi-weekly recurring Computershare buys. The bi-weekly recurring buys were around $900k to $1.5 million. An alternative DRS count estimation may be estimating money spent by retail purchasing GME per quarter. It was around $1.2 million average per 6 recurring Computershare buys per quarter. Then say a massively conservative $200k per other trading day. So: If average $1.2 million spent per bi-weekly purchase, and say $14 a share, multiply by 6 for one GME quarter: * 1,200,000 / 14 = 85,714 shares \* 6 = 514,284 shares * The 6 recurring buys alone should add 514,284 DRS shares. Other 54 trading days: * $200,000 / $14 a share = 14,285 shares a day * 54 \* 14,285 = 771,390 shares Total: 514,284 + 771,390 = +1,285,674 DRS shares a quarter
Was having fun reading: https://www.reddit.com/r/Superstonk/comments/18do2h3/this_totally_blew_my_mind/ In reference to 6days1week: https://twitter.com/6days1week/status/1732795611349418472?t=cEYTlwljKAsyR7f9j2rHQw&s=19 Hate to bring it up for those that made one trek to GameStop HQ. But is it possible to view the GameStop HQ list of stockholders twice a year? Visit late May and mid/late June? Would then have 2 additional DRS data points each year. Was wondering why the cutoff dates were the way they were. Why Thursday 5/26/2022 and Friday 4/21/2023? I think the 2023 visit was in May, so I wonder if a shareholder visited in June, would they have gotten a late May report rather than April's data? |Date|Source| |:-|:-| |10/30/2021|Form 10-Q| |1/29/2022|Form 10-K| |4/30/2022|Form 10-Q| |5/26/2022|List of stockholders| |7/30/2022|Form 10-Q| |10/29/2022|Form 10-Q| |3/22/2023|Form 10-K| |4/21/2023|List of stockholders| |6/1/2023|Form 10-Q| |8/31/2023|Form 10-Q| |11/30/2023|Form 10-Q|
lovetoburst
Now
•
100%
DRSbot witnessing is pretty much down to one reddit user now (shorthand we refer to as NoVac user).
DRSbot has been offline more than online the past 3 weeks. I manually track DRS posts during its offline time. From keeping an eye on DRS posts the past 3-4 months, nothing alarming jumps out.
Was discussing the DRS count f--kery tonight, and there isn't much reason to measure and estimate when "they" can consistently mess with the DRS numbers over the past 2 years.
I think a better gauge may be estimating money spent by retail purchasing GME per quarter. It was around $1.2 million average per 6 recurring Computershare buys per quarter. Then say a massively conservative $200k per other trading day. So:
If average $1.2 million spent per bi-weekly purchase, and say $14 a share, multiply by 6 for one GME quarter:
- 1,200,000 / 14 = 85,714 shares * 6 = 514,284 shares
- The 6 recurring buys alone should add 514,284 DRS shares.
Other 54 trading days:
- $200,000 / $14 a share = 14,285 shares a day
- 54 * 14,285 = 771,390 shares
Total:
514,284 + 771,390 = +1,285,674 DRS shares a quarter.
There, done. I don't have to look at another DRS post again, ever. :)
lovetoburst
Now
•
100%
Yeah, the Youtube algorithm is interesting. I get recommended a bunch of AMC, stock market crash, and GME bashing videos sometimes.
Same with Reddit recommendations. I looked at 1 meltdown post maybe 14 months ago, haven't looked at an AMC post in 2 years, but the algorithm still drums up meltdown and AMC posts on my main page.

12/1/2023 Estimated DRS count: 76,261,272 ((using today's DRSbot total + fix inadvertent DRSbot offline or resets) x 4.175) The 4.175 multiplier comes from 8/31/2023 Form 10-Q divided by DRSbot 8/31/2023 total: 75,400,000 / 18,059,540 = 4.175 Bloomberg data (to 9/11/2023), DRS estimated counts, and other: |Holding|Number of shares|As of| |:-|:-|:-| |ETFs|29,138,064|9/8/2023| |MFs, Index Funds, Pension Funds, etc|33,999,059|9/8/2023| |Other Institutional Ownership|32,373,815|9/8/2023| |Insiders Stagnant|14,339,510|9/8/2023| |Insiders|38,540,578|9/11/2023| |DRS'd - 200k Computershare accounts|76,261,272|12/1/2023| |Non-DRS - 200k acct 25% stuck in IRA|19,065,318|12/1/2023| |Other|61,523,678|12/1/2023| * Total Outstanding on 8/31/2023 and 10/12/2023: 305,241,294 * Thank you to lawsondt for the Bloomberg data to 9/8/2023. * "Non-DRS - 200k acct 25% stuck in IRA" is a conservative percentage. The Google share count surveys have suggested the 200k Computershare accounts have 30-40% additional shares stuck in IRAs. * "Fix inadvertent DRSbot offline or resets" is primarily whale #1's 1,389,665 DRS shares (11/21/2023). Long story of switching subs and losing their DRS share count. So added the "fix inadvertent" column to capture their DRS shares. Discussion points: * It seems "odd" on some of the DRS count fluctuations since the beginning. * It seems "odd" on recent DRS count stagnating (excluding the Mainstar rugpull of 1.27 million shares). From a very simplistic view assuming 200,000 Computershare accounts: |Buy X number of shares a month|Multiply by 3 months per quarter|Total DRS per quarter if 100,000 active accounts|Total DRS per quarter if 200,000 active accounts| |:-|:-|:-|:-| |1|3|300,000|600,000| |2|6|600,000|1,200,000| |3|9|900,000|1,800,000| |4|12|1,200,000|2,400,000| |5|15|1,500,000|3,000,000| * The April 2023 List of stockholders DRS numbers seem correct and line up with SEC filings. * Possible some investors have had to un-DRS. * Possible economic slowdown has reduced investor purchasing power. * Possible whale investors who helped inflate DRS numbers alot, have dramatically slowed down their purchasing. * Tinfoil - forces inflating DRS shares 9 to 12 months back, then draining their DRS shares later. Probably spread across say 3,000 accounts to make it seem like normal activity. * Tinfoil - possible something funny with SEC filing reported number. * There is the recent post from sister sub, google search on: Deep analysis on Computershare recurring buys reddit He examines the bi-weekly recurring Computershare buys. If say average $1.2 million spent per bi-weekly purchase, and say $14 a share, multiply by 6 for one GME quarter: 1,200,000 / 14 = 85,714 shares * 6 = 514,284 The 6 recurring buys alone should add 514,284 DRS shares.
lovetoburst
Now
•
100%
I've watched Richard Newton's youtube videos for a while. He's been very helpful explaining what's possibly happening via swaps, ETFs, OpEx, cycles, derivatives, etc. Also nice past videos explaining GameStop SEC filings, DRS, GameStop marketplace, former wallet, Loopring, ImmutableX, NFTs, ethereum, crypto, etc.

11/24/2023 Estimated DRS count: 76,178,920 ((using today's DRSbot total + fix inadvertent DRSbot offline or resets) x 4.175) The 4.175 multiplier comes from 8/31/2023 Form 10-Q divided by DRSbot 8/31/2023 total: 75,400,000 / 18,059,540 = 4.175 Bloomberg data (to 9/11/2023), DRS estimated counts, and other: |Holding|Number of shares|As of| |:-|:-|:-| |ETFs|29,138,064|9/8/2023| |MFs, Index Funds, Pension Funds, etc|33,999,059|9/8/2023| |Other Institutional Ownership|32,373,815|9/8/2023| |Insiders Stagnant|14,339,510|9/8/2023| |Insiders|38,540,578|9/11/2023| |DRS'd - 200k Computershare accounts|76,178,920|11/24/2023| |Non-DRS - 200k acct 25% stuck in IRA|19,044,730|11/24/2023| |Other|61,626,618|11/24/2023| * Total Outstanding on 8/31/2023 and 10/12/2023: 305,241,294 * Thank you to lawsondt for the Bloomberg data to 9/8/2023. * "Non-DRS - 200k acct 25% stuck in IRA" is a conservative percentage. The Google share count surveys have suggested the 200k Computershare accounts have 30-40% additional shares stuck in IRAs. * "Fix inadvertent DRSbot offline or resets" is primarily whale #1's 1,389,665 DRS shares (11/21/2023). Long story of switching subs and losing their DRS share count. So added the "fix inadvertent" column to capture their DRS shares. Discussion points: * It seems "odd" on some of the DRS count fluctuations since the beginning. * It seems "odd" on recent DRS count stagnating (excluding the Mainstar rugpull of 1.27 million shares). From a very simplistic view assuming 200,000 Computershare accounts: |Buy X number of shares a month|Multiply by 3 months per quarter|Total DRS per quarter if 100,000 active accounts|Total DRS per quarter if 200,000 active accounts| |:-|:-|:-|:-| |1|3|300,000|600,000| |2|6|600,000|1,200,000| |3|9|900,000|1,800,000| |4|12|1,200,000|2,400,000| |5|15|1,500,000|3,000,000| * The April 2023 List of stockholders DRS numbers seem correct and line up with SEC filings. * Possible some investors have had to un-DRS. * Possible economic slowdown has reduced investor purchasing power. * Possible whale investors who helped inflate DRS numbers alot, have dramatically slowed down their purchasing. * Tinfoil - forces inflating DRS shares 9 to 12 months back, then draining their DRS shares later. Probably spread across say 3,000 accounts to make it seem like normal activity. * Tinfoil - possible something funny with SEC filing reported number. * There is the recent post from sister sub, google search on: Deep analysis on Computershare recurring buys reddit He examines the bi-weekly recurring Computershare buys. If say average $1.2 million spent per bi-weekly purchase, and say $14 a share, multiply by 6 for one GME quarter: 1,200,000 / 14 = 85,714 shares * 6 = 514,284 The 6 recurring buys alone should add 514,284 DRS shares.
redditor dminvesta with the 217,xxx high score. Via https://www.reddit.com/r/Superstonk/comments/180s1wn/are_we_still_doing_this_holder_account_number/ |Date|Computershare Accounts| |:-|:-| |5/8/2023|213,4xx| |8/2023 or 9/2023|213,500| |10/24/2023|216,3xx| |11/21/2023|217,xxx|
lovetoburst
Now
•
100%
Watched network traffic on lemmyverse.net while scrolling down. The lemmy.today and normalcity.life blocking was on a couple image files is all:
- https://lemmy.today/pictrs/image/1207acb9-287a-40ff-b2b7-52db0636bbb0.png
- https://normalcity.life/pictrs/image/2bbfc82a-c9f0-4f54-89e2-172a1aa20c4c.png
Ah well, just Malwarebytes being Malwarebytes.
lovetoburst
Now
•
100%
As a side note, even though Malwarebytes threw the warning and blocked whatever the lemmy.today call was. The Subscribe action went through and let me join The PPShow community.
Yeah, I should test it joining another lemmy.world community, but I barely use lemmy at the moment. Darn reddit addiction!
I visited https://lemmyverse.net/ that you mentioned and Malwarebytes started blocking lemmy.today, normalcity.life, so I stopped scrolling on their main page.
lovetoburst
Now
•
100%
That's where the SEC filing oddities kick in. Is it strange that 200,000 Computershare accounts are only progressing at:
- +500,000 DRS over 91 days (5,494 per day)
- +265,982 DRS over 30 days (8,866 per day)
- +334,018 DRS over 41 days (8,146 per day)
- +638,774 over 71 days (8,997 per day)
But simple math of when just ONE share a month for 200,000 accounts would be +600,000 a quarter?
It's possible many of us are overestimating the 200,000 accounts' purchasing power. Or something funny is going on.
This next Form 10-Q data point should be interesting!
lovetoburst
Now
•
100%
Hey @Chives@lemmy.whynotdrs.org , Did you get any malware warning when clicking on the Subscribe button for The PPShow @ lemmy.world?
Probably just my Malwarebytes being picky:
- Potential threat blocked: The following website appears malicious: lemmy.today
Did a site scan online of lemmy.today via: https://sitecheck.sucuri.net/
Results:
Website Malware & Security
- No malware detected by scan (Low Risk)
- No injected spam detected (Low Risk)
- No defacements detected (Low Risk)
- No internal server errors detected (Low Risk)
Website Blacklist Status
- Domain clean by Google Safe Browsing
- Domain clean by McAfee
- Domain clean by Sucuri Labs
- Domain clean by ESET
- Domain clean by PhishTank
- Domain clean by Yandex
- Domain clean by Opera
Hardening Improvements: Protection: No website application firewall detected. Please install a cloud-based WAF to prevent website hacks and DDoS attacks.
Security Headers: Missing security header for ClickJacking Protection. Alternatively, you can use Content-Security-Policy: frame-ancestors 'none'.
Affected pages:
Missing security header to prevent Content Type sniffing. Affected pages:
Missing Strict-Transport-Security security header.
Whois on lemmy.today:
Raw Whois Data
- Domain Name: lemmy.today
- Registrar WHOIS Server: whois.namecheap.com
- Updated Date: 2023-06-11T15:11:22Z
- Creation Date: 2023-06-06T15:10:39Z
- Registry Expiry Date: 2024-06-06T15:10:39Z
- Registrar: NameCheap, Inc.
- Registrant Name: REDACTED FOR PRIVACY

11/17/2023 Estimated DRS count: 76,070,216 ((using today's DRSbot total + fix inadvertent DRSbot offline or resets) x 4.175) The 4.175 multiplier comes from 8/31/2023 Form 10-Q divided by DRSbot 8/31/2023 total: 75,400,000 / 18,059,540 = 4.175 Bloomberg data (to 9/11/2023), DRS estimated counts, and other: |Holding|Number of shares|As of| |:-|:-|:-| |ETFs|29,138,064|9/8/2023| |MFs, Index Funds, Pension Funds, etc|33,999,059|9/8/2023| |Other Institutional Ownership|32,373,815|9/8/2023| |Insiders Stagnant|14,339,510|9/8/2023| |Insiders|38,540,578|9/11/2023| |DRS'd - 200k Computershare accounts|76,070,216|11/17/2023| |Non-DRS - 200k acct 25% stuck in IRA|19,017,554|11/17/2023| |Other|61,762,498|11/17/2023| * Total Outstanding on 8/31/2023 and 10/12/2023: 305,241,294 * Thank you to lawsondt for the Bloomberg data to 9/8/2023. * "Non-DRS - 200k acct 25% stuck in IRA" is a conservative percentage. The Google share count surveys have suggested the 200k Computershare accounts have 30-40% additional shares stuck in IRAs. * "Fix inadvertent DRSbot offline or resets" is primarily whale #1's 1,388,490 DRS shares. Long story of switching subs and losing their DRS share count. So added the "fix inadvertent" column to capture their DRS shares. Discussion points: * It seems "odd" on some of the DRS count fluctuations since the beginning. * It seems "odd" on recent DRS count stagnating (excluding the Mainstar rugpull of 1.27 million shares). From a very simplistic view assuming 200,000 Computershare accounts: |Buy X number of shares a month|Multiply by 3 months per quarter|Total DRS per quarter if 100,000 active accounts|Total DRS per quarter if 200,000 active accounts| |:-|:-|:-|:-| |1|3|300,000|600,000| |2|6|600,000|1,200,000| |3|9|900,000|1,800,000| |4|12|1,200,000|2,400,000| |5|15|1,500,000|3,000,000| * The April 2023 List of stockholders DRS numbers seem correct and line up with SEC filings. * Possible some investors have had to un-DRS. * Possible economic slowdown has reduced investor purchasing power. * Whale investors who helped inflate DRS numbers alot, have dramatically slowed down their purchasing. * Tinfoil - possible there have been forces inflating and draining their DRS shares, spread across say 3,000 accounts to make it seem like normal activity. * Tinfoil - possible something funny with SEC filing reported number.
lovetoburst
Now
•
100%
I'd hazard a guess that we're well past Other of 61,801,800 shares in brokerages.
If only 200,000 Computershare accounts hold 76,038,774 plus non-conservative 50% additional stuck in IRAs (38,019,387) = 114,058,161 shares
| Number of retail holders (non-Computershare account) | Number of shares | Total shares |
|---|---|---|
| 2,000,000 | 50 | 100,000,000 |
| 4,000,000 | 50 | 200,000,000 |
| 2,000,000 | 100 | 200,000,000 |
| 2,000,000 | 150 | 300,000,000 |
| 2,000,000 | 200 | 400,000,000 |
| 2,000,000 | 250 | 500,000,000 |
| 2,000,000 | 300 | 600,000,000 |
| 2,000,000 | 350 | 700,000,000 |
| 4,000,000 | 175 | 700,000,000 |
I don't think it'd be a stretch to say 4,000,000 retail holders each hold 50 shares = 200,000,000
29,138,064 + 33,999,059 + 32,373,815 + 14,339,510 + 38,540,578 + ~60,000,000 reported short + 114,058,161 + 200,000,000 = 522,449,187
If 4,000,000 hold 175 shares = 700,000,000. 522,449,187 + additional 500,000,000 = 1,022,449,187

11/10/2023 Estimated DRS count: 76,038,774 ((using today's DRSbot total + fix inadvertent DRSbot offline or resets) x 4.175) The 4.175 multiplier comes from 8/31/2023 Form 10-Q divided by DRSbot 8/31/2023 total: 75,400,000 / 18,059,540 = 4.175 Bloomberg data (to 9/11/2023), DRS estimated counts, and other: |Holding|Number of shares|As of| |:-|:-|:-| |ETFs|29,138,064|9/8/2023| |MFs, Index Funds, Pension Funds, etc|33,999,059|9/8/2023| |Other Institutional Ownership|32,373,815|9/8/2023| |Insiders Stagnant|14,339,510|9/8/2023| |Insiders|38,540,578|9/11/2023| |DRS'd - 200k Computershare accounts|76,038,774|11/10/2023| |Non-DRS - 200k acct 25% stuck in IRA|19,009,694|11/10/2023| |Other|61,801,800|11/10/2023| * Total Outstanding on 8/31/2023 and 10/12/2023: 305,241,294 * Free float on 9/11/2023: 156,850,268 * Thank you to lawsondt for the Bloomberg data to 9/8/2023. * Added Larry +6000 and Alain +15000 to Insiders number on 9/11/2023. * "Non-DRS - 200k acct 25% stuck in IRA" is a conservative percentage. The Google share count surveys have suggested the 200k Computershare accounts have 30-40% additional shares stuck in IRAs. * "Fix inadvertent DRSbot offline or resets" is primarily whale #1's 1,388,490 DRS shares. Long story of switching subs and losing their DRS share count. So added the "fix inadvertent" column to capture their DRS shares.
lovetoburst
Now
•
100%
Further ruminating, using very conservative numbers.
Not even using 200,000 Computershare accounts. Say just 100,000 accounts.
Is it a stretch to say 100,000 accounts DRS 5 shares a month? 100,000 x 5 shares a month x 3 months = 1,500,000 a quarter
5 shares a month * $22 avg = $110 a month * 3 months = $330 a quarter
Or only 1 to 3 shares a month for 200,000 accounts:
- 1 share a month = 600,000 a quarter
- 2 shares a month = 1,200,000 a quarter
- 3 shares a month = 1,800,000 a quarter
lovetoburst
Now
•
80%
It seems the underlying question is if the DTCC has any effect on what Computershare provides GameStop for the DRS numbers.
I'm assuming Computershare the transfer agent keeps its own share count and provides the information to GameStop.
- Computershare -> GameStop
Assuming there is no DTCC step where the DTCC tells Computershare what's on DTCC side, so Computershare has to fudge their numbers to match, then tell GameStop.
Has there been any information that shows the flow of share count data is:
- DTCC -> Computershare -> GameStop
If we include the non-official DRS numbers with the official GameStop SEC filings:
| Date | DRS in Millions | Notes |
|---|---|---|
| 10/30/21 | 20.80 | SEC filing |
| 01/29/22 | 35.60 | SEC filing |
| 04/30/22 | 50.80 | SEC filing |
| 05/26/22 | 47.01 | List of stockholders |
| 07/30/22 | 71.30 | SEC filing |
| 10/29/22 | 71.80 | SEC filing |
| 03/22/23 | 76.00 | SEC filing |
| 04/21/23 | 76.26 | List of stockholders |
| 06/01/23 | 76.60 | SEC filing |
| 06/20/23 | 75.33 | Mainstar rugpull -1,270,566 |
| 08/31/23 | 75.40 | SEC filing |
The May 2023 visit to GameStop HQ for the 04/21/23 list of stockholders numbers:
Using your numbers:
- 10/29/22 71.80
- 03/22/23 103.2382 - would be like 31.4 million shares times $25 average = $785,000,000
- 06/01/23 114.7828 - like 11.54 million shares times $21 average = $242,340,000
- 08/31/23 129.5794 - like 14.8 million shares times $22 average = $325,600,000
From a dollar amount $1,352,940,000 / 200,000 Computershare accounts = $6,765 each / $22 avg = +308 shares each over 10 months (31 shares a month).
Plausible, but it may be tough for the average holder to spend $676 a month on GME shares. And without the whales buying as much as they initially did, it skews the numbers down too.
lovetoburst
Now
•
100%
Note that it's mostly DRSbot's data. I started spreadsheet tracking partly due to Whale #1's 1.2 million shares got lost in DRSbot's count. Due to Whale #1 moving his DRSbot post from GME Orphans to DRSyourGME, then DRSyourGME got nuked. And Whale #1 isn't much for technology so said "Forget it" to re-authenticating his now 1.3 million shares. He did add 2,000 more shares last quarter, so nice to know he's still in it.
Other reason was to try and see if something, anything jumped out with DRS numbers over time. The DRS numbers that GME declares in the SEC Forms seems correct. But over time the DRS number jumping all over the place seems odd. DRS timeline table: https://www.reddit.com/r/drsgme/comments/16m11vq/drs_numbers_timeline_updated_9182023/
Going on 3 years of the GME saga, and it's like wading through pea soup still.
lovetoburst
Now
•
100%
Whoops, I think you may be misinterpreting the spreadsheet and graph I put together. I'll rename the labels some and pick a less "Computershare purple" color in this week's graph to clarify more.
I wanted to highlight that just 200k Computershare accounts owned 75.5 million DRS shares. And these 200k CS accounts also have a conservative 25% more shares stuck in IRA accounts (not DRS'd). So 75.5 million DRS'd and 18.9 million stuck in IRA accounts. Rather than 85-90 million DRS'd in Computershare.
I was trying to convey that just 200k CS accounts hold 75.5 million DRS and 18.9 million in IRA accounts. And the "remaining 62 million shares" likely doesn't add up if we think about the total number of retail brokerage, margin, and IRA accounts holding GME.
lovetoburst
Now
•
100%
From Richard Newton’s google surveys. I’ll have to go through his recent videos–thought he mentioned 30-50% stuck in IRA accounts, etc but will double check.
lovetoburst
Now
•
100%
Depends on your definition of stagnation. DRS is around 5,405 shares a day since 6/20/2023 Mainstar rugpull of -1.27 million shares.
The 38.54 million shares of Cohen, Nir, Alain, Lawrence, James, Xu, and Moore are either purchased in the market or granted from I believe the GameStop share pool. I think this pool's number is listed somewhere in a SEC form.
From the last Form 10-Q the last 3 months ended July 29, 2023 the number of outstanding shares increased 600,000. For last 6 months it increased 700,000. Stock vests around the shareholder meeting. Something like 8,772 shares granted to each board member. And they've been awarding longer term store employees with shares the past year or so.
Others can explain number of shares far better than me. I think there were a couple reddit posts over the summer looking into the amount of shorts and shares over the outstanding.
lawsondt's Bloomberg data post lists institutions holding GME. The usual suspects lending millions of shares out.
 Now
Now
lovetoburst
lemmy.whynotdrs.orgRetired gamer